PSI Data Brain
The master reference for all PSI data — what exists, where it lives, how to access it, what questions it answers, and how everything connects. This is the canonical first-stop for any data question at PSI.
Machine-readable companion:
data-brain.yaml— structured version for AI agents and MCP tools.
How to Use This Page
This is PSI’s data knowledge graph — a context-friendly map designed so that any person or AI agent can quickly understand:
- What data exists across all PSI systems
- Where each source lives (file path, API endpoint, database)
- How to access it (query method, authentication, tools)
- What questions it answers (use cases)
- How sources connect to each other (joins, foreign keys)
Maintenance Protocol: Every time analysis is performed using PSI data, this page gets updated with any new sources, joins, schema details, or gotchas discovered. Each section includes a “Last Verified” date to make staleness visible.
Data Universe Overview
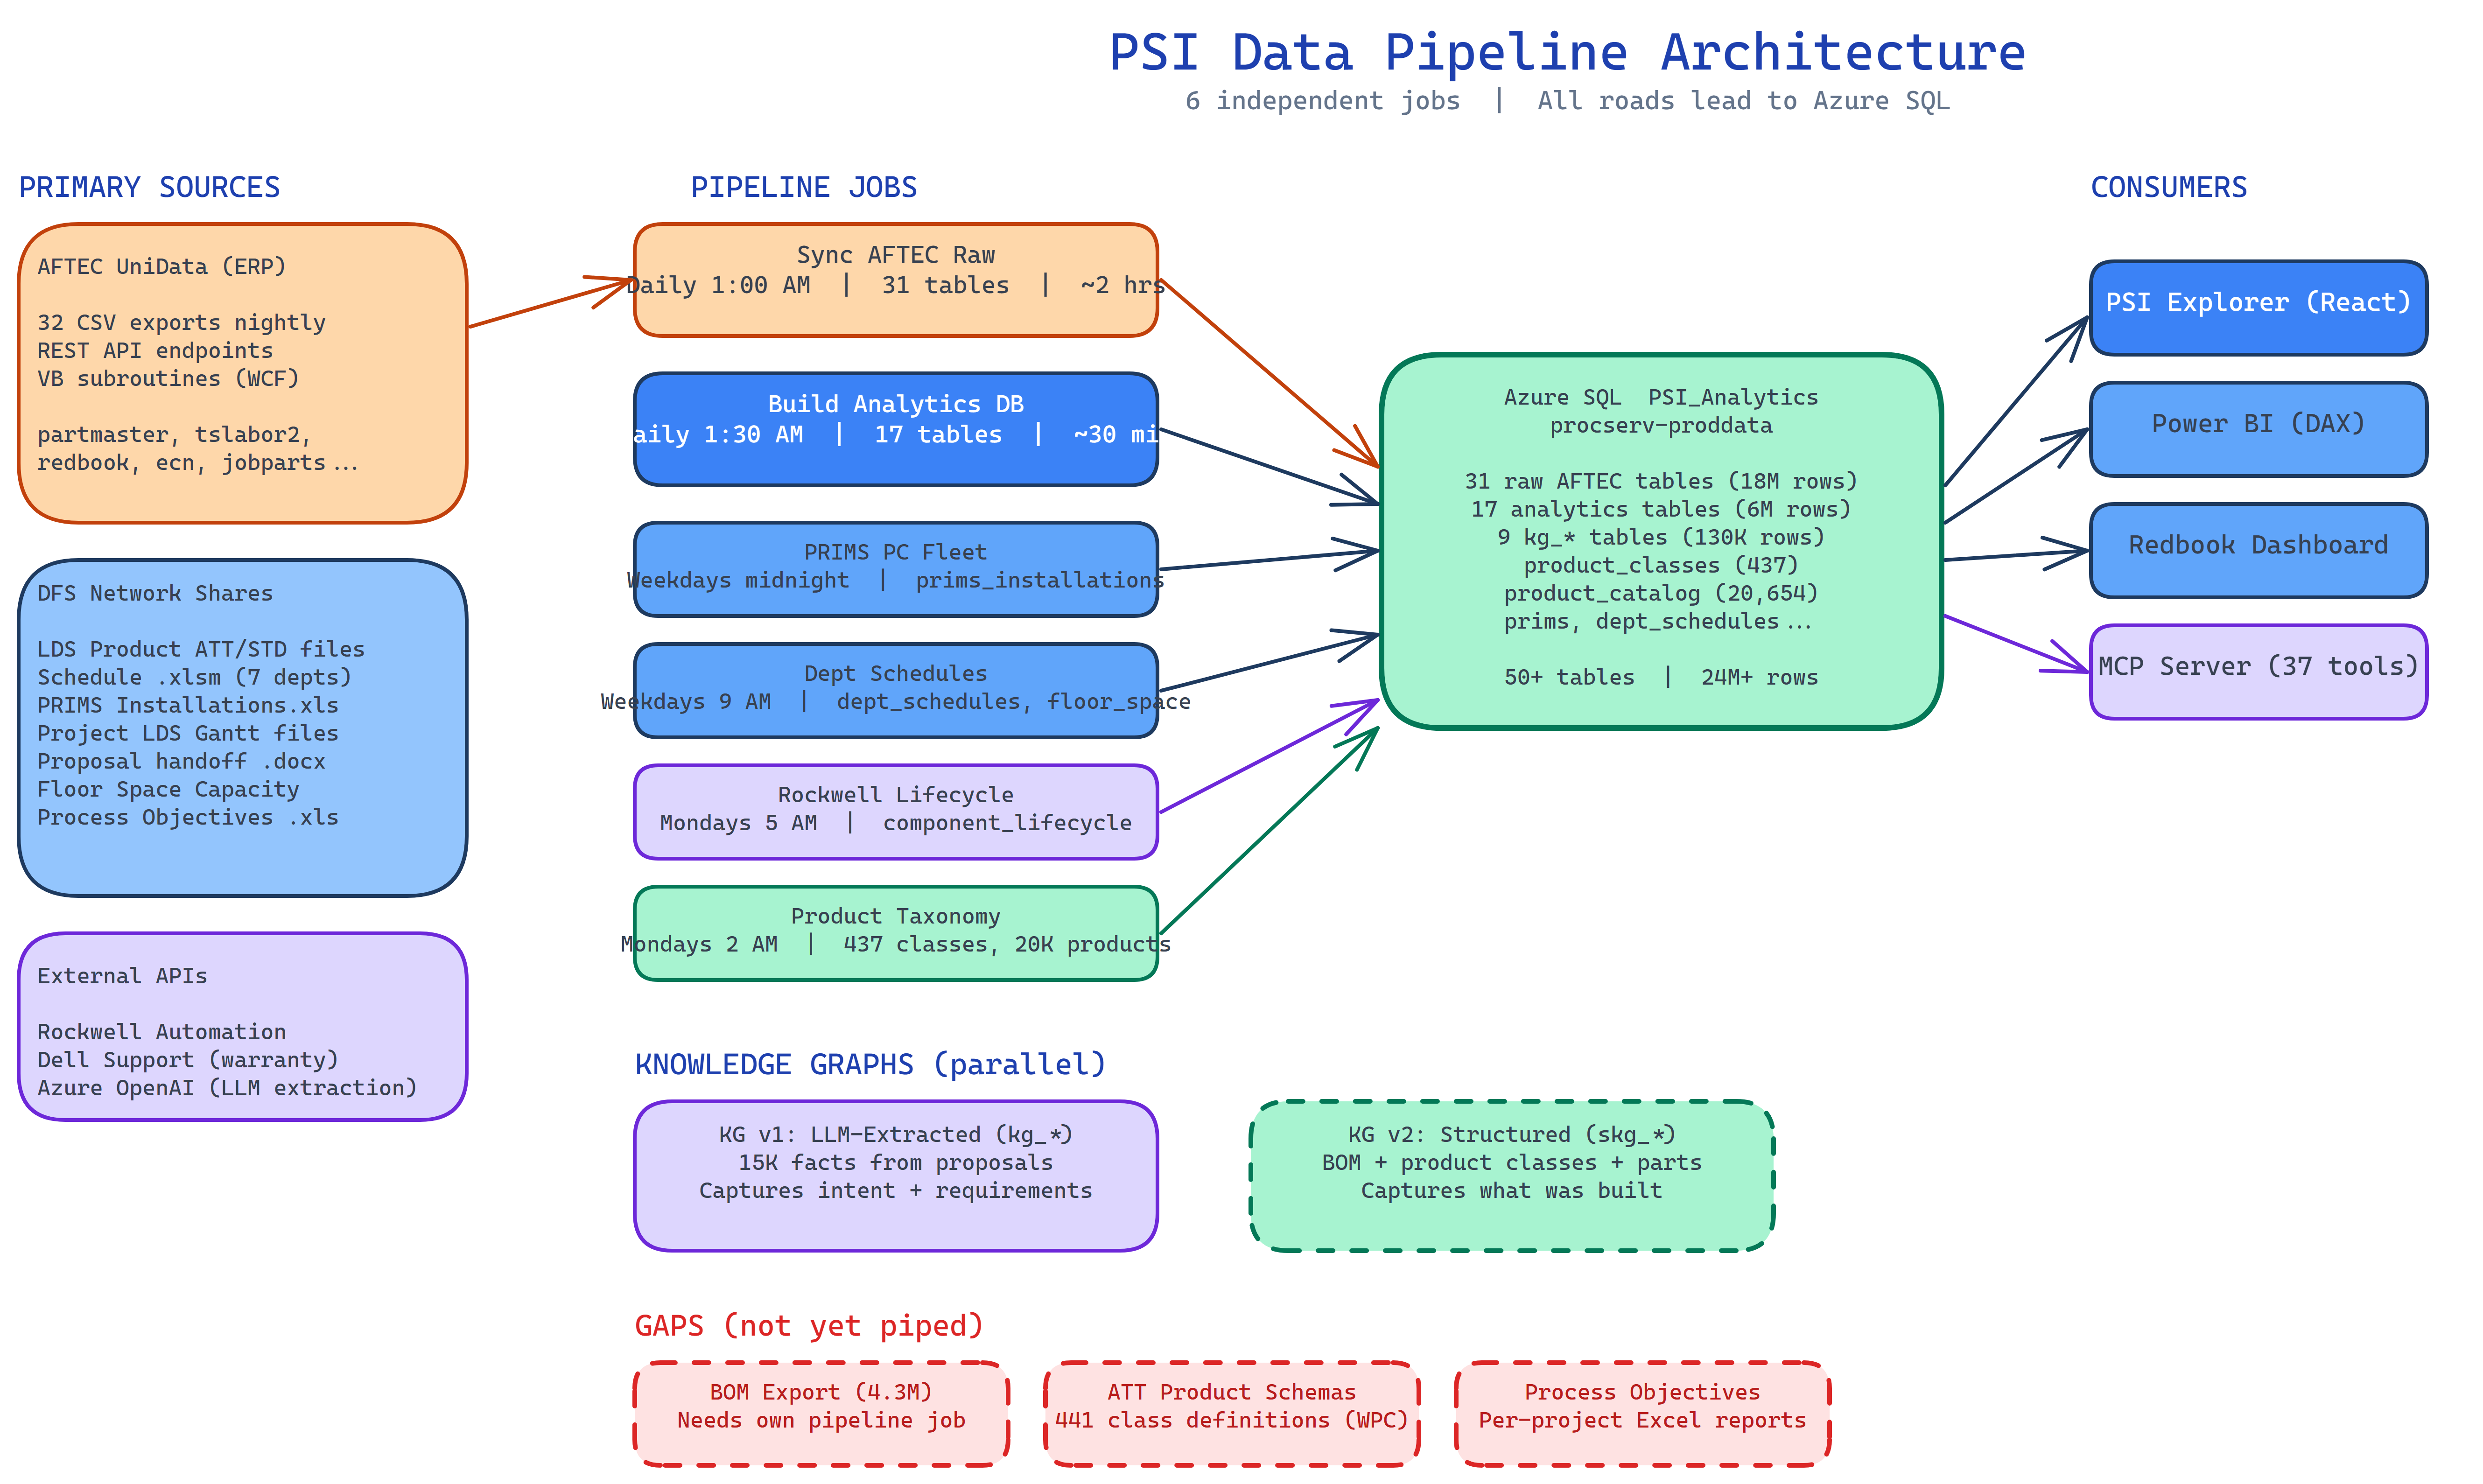
Full diagram: sources (left), 6 independent pipeline jobs (center), Azure SQL destination (right), consumers (far right). Gaps shown in red dashed boxes. Editable source: psi-data-pipeline/docs/data-flow-diagram.excalidraw
Azure SQL PSI_Analytics is the primary data store. All applications and reports should connect here. Ten independent pipeline jobs ingest data from AFTEC ERP exports, scraper-owned sources, and the knowledge graph — each on its own schedule, each responsible for its own tables.
1. PRIMARY DATA SOURCES
1.1 PSI Analytics Database (Azure SQL — Primary)
Last Verified: 2026-04-20
| Property | Value |
|---|---|
| What | PSI’s unified data store — 24.4M rows across 50 tables. The preferred way to access all PSI data. |
| Where | procserv-proddata.database.windows.net → PSI_Analytics |
| Auth | Azure AD (user or service principal). Private endpoint at 10.160.140.4 for internal traffic via VPN. |
| Repo | psi-data-pipeline (10 workflows in .github/workflows/) |
| Refresh | 10 independent pipeline jobs on GHE Actions (PS-PROXY self-hosted runner) — see schedule below |
| Consumers | Redbook Dashboard (Streamlit), Power BI reports, PSI Explorer, Document Manager (via PSILocalService/WCF), direct SQL queries |
This is the single source of truth for PSI analytics and operational data. It consolidates AFTEC ERP exports, AI-classified quality data, workforce features, BOM hierarchies, lessons learned, and more into one queryable database. All new applications and reports should connect here — not to CSV files or other intermediate stores.
How to connect:
- Power BI:
Sql.Database("procserv-proddata.database.windows.net", "PSI_Analytics")with Azure AD auth - Python:
pyodbcwith MSAL token auth (seeScripts/data/loader.pyin redbook-dashboard) - Direct query: Azure Data Studio, SSMS, or
az sql querywith your PSI Azure AD account
Pipeline job schedule:
| Job | Workflow | Schedule | Tables Owned | Duration |
|---|---|---|---|---|
| AFTEC Raw to Azure SQL | sync-aftec-raw.yml | Daily 1:00 AM ET | 31 raw AFTEC tables (partmaster, tslabor2, etc.) | ~2 hours |
| Build Analytics DB | nightly-data-build.yml | Daily 1:30 AM ET | 17 analytics tables (projects, labor_detail, bom_parts, etc.) | ~30 min |
| Sync BOM Data | sync-bom-data.yml | Weekdays 3:00 AM ET | bom_parts | ~2 hours |
| Sync KG Data | sync-kg-data.yml | Daily 2:00 AM ET | kg_* tables | ~1 min |
| PRIMS PC Fleet | sync-prims.yml | Weekdays midnight ET | prims_installations | ~2 min |
| Dept Schedules | sync-dept-schedules.yml | Weekdays 9:00 AM ET | dept_schedules, floor_space | ~2 min |
| Component Lifecycle | sync-rockwell.yml | Mondays 5:00 AM ET | component_lifecycle, project_components | ~5 min |
| Product Taxonomy | sync-product-taxonomy.yml | Mondays 2:00 AM ET | product_classes, product_catalog | ~1 min |
| Dell Warranty Enrichment | enrich-dell-warranty.yml | Saturdays 7:00 AM ET | dell_warranty (Azure SQL direct) | ~5 min |
| Setup Env Vars | setup-env-vars.yml | Manual trigger only | (System environment) | <1 min |
Each job is independent — failures don’t cascade. The Component Lifecycle job now extracts both Rockwell/Allen-Bradley and GE/Emerson catalog numbers from BOM descriptions (488+ Rockwell parts via public API, 38+ GE parts via static reference — no GE lifecycle API exists). The knowledge graph tables (kg_*) are imported by the analytics build from psi_ingest.db. Full architecture: psi-data-pipeline/docs/pipeline-architecture.md.
Two categories of tables:
1. Analytics tables (17 tables, 6.3M rows) — enriched/derived data not available elsewhere:
| Table | Rows | Description |
|---|---|---|
bom_parts | 4,362,913 | BOM hierarchy (19 columns) |
labor_detail | 1,379,326 | Timesheets filtered to project jobs |
work_orders | 435,958 | Work orders filtered to project jobs |
redbooks | 40,040 | AI-classified quality issues (73 columns, with severity/category/root cause) |
ecn_detail | 26,983 | ECNs with Code field (Engineering/Customer/Manufacturing/etc.) |
ncn_detail | 17,789 | Non-conformance notices |
department_summary | 15,978 | Per-(job, dept) aggregates with P2/P98 dates |
purchase_orders | 13,467 | PO data matched to projects |
change_orders | 8,395 | K: drive change order extractions |
machine_dna_features | 3,084 | Quality prediction feature matrix (82 features) |
projects | 2,569 | Core project identity (job, customer, dates, lead times, budget) |
workforce_features | 1,875 | Per-project workforce metrics (tenure, HHI, corrective hrs) |
lessons_learned | 1,166 | OneNote lessons learned extraction |
handoff_extractions | 551 | Handoff .docx parsing (comp machine refs, risks) |
plc_complexity | 467 | PLC program complexity scores |
rd_classification | 105 | R&D project flags |
product_classes | 437 | AFTEC product class taxonomy (ClassID, ClassName) |
product_catalog | 20,654 | Products mapped to classes (ProductNumber, ClassID, Phys) |
dept_schedules | ~3,000 | Department schedule entries from PMO Excel files |
floor_space | ~200 | Floor space capacity bays |
comprehensive_view | 2,569 | SQL view joining all analytics tables |
These tables are also published through two upstream SQLite pipeline stages on PS-PROXY:
\\ad.ptihome.com\DFS\Schedule\SS123\LEADTIME\psi_ingest.db— durable ingest cache for scraper-owned tables that are expensive or slow to rebuild (prims_installations,component_lifecycle,project_components,product_classes,product_catalog,dept_schedules,floor_space,kg_*,cpq_*)\\ad.ptihome.com\DFS\Schedule\SS123\LEADTIME\psi_analytics.db— rebuildable analytics artifact used as the local publish source before data is synced to Azure SQL
Applications and reports should still treat Azure SQL PSI_Analytics as the primary data store. The SQLite files are pipeline stages, not the preferred app/report query target.
2. Raw AFTEC tables (32 tables, 18.1M rows) — full ERP exports, same schema as the CSV files:
| Table | Rows | Domain |
|---|---|---|
inventoryhistory | 7,903,102 | Inventory transactions |
tslabor2 | 5,255,126 | All timesheets (unfiltered) |
wiprouteline | 1,559,452 | Manufacturing routing |
openwo | 741,342 | All work orders |
partmaster | 592,914 | Parts master |
pohist | 488,624 | Purchase history |
wiplabor | 358,576 | WIP labor tracking |
invoiceline | 224,870 | Invoice lines |
jobparts | 204,548 | Job-to-parts |
purchaseorders | 108,466 | Purchase orders |
| + 22 more tables | See Fabric ProgressiveDataSet for full list |
Column names match the CSV headers exactly — existing Power BI DAX measures work unchanged when re-pointed to Azure SQL.
Key advantages over CSV/Fabric:
- Multi-row data is queryable (e.g.,
SELECT code, COUNT(*) FROM ecn_detail WHERE project = '2422' GROUP BY code) - Concurrent access from multiple applications without file locking
- Proper indexing for fast lookups
- Power BI DirectQuery support (no Import mode refresh delay)
- Private endpoint access via VPN — no data leaves PSI’s network
Backwards compatibility: The nightly build also exports comprehensive_dataset.csv to the LEADTIME share for spreadsheet consumers.
1.2 AFTEC ERP Database (UniData — Upstream Source)
Last Verified: 2026-02-26
| Property | Value |
|---|---|
| What | Core ERP system — orders, jobs, parts, labor, inventory, purchasing, costing |
| Where | MRP-PROD server (on-premises UniData) |
| Access | Via PSI.UniData.API (REST), PSILocalService (WCF), or U2 Toolkit for .NET (direct) |
| Key Tables | PROJECT.1287, MACHTYPE.1287, OPENWO, INVHIST, REDBOOK.1287, PRODUCT.1287, PRODUCT.CLASS.1287, PRODUCT.LDS.1287, INDSECTOR.1287, INDCLASS.1287, PART.PHOTOS.1287 |
| Refresh | Real-time (live queries) |
| Answers | ”What is the current status of job X?”, “What parts are on this BOM?” |
AFTEC is the origin of most PSI data. Its 32 CSV exports feed into the nightly pipeline that builds Azure SQL PSI_Analytics. For analytics and reporting, query Azure SQL instead of AFTEC directly — it has the same data plus enrichments (AI classification, workforce features, etc.).
370 VB_ subroutines* provide structured access to ERP operations.
Key schema detail (PO promise dates): AFTEC stores up to 4 promise date/quantity pairs per PO line via VB_PO.LINE.REV1 subroutine, but the PSI.UniData.API currently only exposes 1 promise date. The CSV export (purchaseorders.csv) also only contains the current promise date, not the original. This means promise date drift cannot be tracked from existing exports. See Known Gaps.
1.3 AFTEC CSV Exports (\\ad.ptihome.com\DFS\DATA\unixshare\dgwreportfiles\)
Last Verified: 2026-03-12
| Property | Value |
|---|---|
| What | 32 CSV files exported daily from AFTEC — ingested nightly into Azure SQL |
| Where | \\ad.ptihome.com\DFS\DATA\unixshare\dgwreportfiles\ (network share, DFS path) |
| Format | Pipe-delimited (` |
| Access | Direct file read (VPN required), or query Azure SQL (preferred) |
| Refresh | Updated by AFTEC export jobs at 5AM; loaded into Azure SQL at 1AM ET |
| Total Records | ~9.6 million rows across 32 tables |
For analytics and reporting, use Azure SQL PSI_Analytics instead of reading these CSV files directly. The raw AFTEC tables in Azure SQL have the exact same columns and data, with the benefits of SQL indexing and concurrent access. The CSVs remain as the upstream source that the pipeline reads from.
Critical Files for Lead Time Analysis
| File | Rows | Key Fields | Answers |
|---|---|---|---|
| ganttJOB.csv | 903 | Job, Dept, Start, End, % Complete | ”What’s the schedule for each dept on each project?” ⚠️ Active projects only (~83 jobs). Historical projects are NOT retained — use LDS Gantt extraction instead. |
| ganttWO.csv | 7,776 | Job, WO, Part, Op, Start, End, % Comp | ”What’s the WO-level schedule?“ |
| openwo.csv | 519,286 | WO, Job, Make/Release/Start/Due/Close Date, Status | ”How long do work orders take? Which are late?“ |
| tslabor2.csv | 2,773,043 | Date, Dept, Emp, Job, WO, Op, Labor hrs | ”Where are labor hours being spent?“ |
| wiprouteline.csv | 927,344 | Job, WO, Op, PlanStart/Comp, ActStart/Comp, % Comp | ”Planned vs actual at operation level” |
| wiplabor.csv | 253,395 | Job, WO, Part, Routed vs Actual hrs by dept | ”Are we over/under on hours by dept?“ |
| wc-capacity.csv | 31 | Work center capacity hours | ”What’s our weekly capacity by work center?“ |
| capacity.csv | 23,834 | Detailed capacity planning data | ”What’s the load vs capacity outlook?“ |
| redbook.csv | 50,057 | RFC entries with dept flags, dates, days open | ”What quality issues are impacting schedules?“ |
| ecn.csv | 28,266 | ECN entries with change type code, dept, dates, drawing | ”How many engineering changes per project? What type?“ |
| purchaseorders.csv | 108,768 | PO, Promise Date, Lead Time, Vendor | ”Are vendors delivering on time?“ |
| pohist.csv | 268,238 | PO receipt history | ”Actual vendor delivery performance” |
| jobparts.csv | 203,277 | Job-to-part BOM linkage | ”What parts are on each job?“ |
| salesorder.csv | 351 | Order date, amount, customer | ”When was the order placed?“ |
| budgetjob.csv | 1,058 | Job budget allocations | ”What’s the budget vs actual?“ |
| partmaster.csv | 420,950 | Mfg LT, Pur LT, Cum LT per part | ”What are standard lead times?“ |
tslabor2.csv — Detailed Schema
Last Verified: 2026-02-26 — Schema confirmed via direct file read and Fabric table inspection.
| Column | Description | Example |
|---|---|---|
| ID | Record identifier | ”12345” |
| Date | Labor date (MM/DD/YY) | “02/13/23” |
| WE Date | Week-ending date | ”02/18/23” |
| Dept | Department code | ”110E” |
| Emp | Employee number | ”651” |
| Employee Name | Full name (LAST, FIRST MI) | “SMITH, ANDREW L” |
| Line | Line number | ”1” |
| Job | Job/project number | ”2247” |
| WO | Work order number | ”2247” |
| Part | Part number | ”PROJECT WORK ORDERS” |
| Part Description | Part description text | ”PROJECT WORK ORDERS” |
| Op | Operation code | ”80” |
| Op Desc | Operation description | ”CONTROLS DESIGN” |
| Qty | Quantity | ”1” |
| Setup | Setup hours | ”0.0” |
| Labor | Labor hours | ”8.0” |
| P/C | Part/component flag | ”C” |
Department codes — HR/employment vs timesheet entry:
There are two numbering systems. HR/employment uses simplified codes (110, 111, 120). Timesheets use subdivided codes (110M, 110E, 122). Timesheet codes have been stable since ~2000.
| HR Dept | Official Name | TS Code | Timesheet Notes |
|---|---|---|---|
| 100 | Maintenance | 100 | Facility maintenance, janitorial |
| 101 | Administration | 101 | |
| 102 | Machining | 102 | VF4, ST30, prototyping. 7,213 project-dept pairs (most common) |
| 104 | Welding | 104 | Bench weld, saw, bend, punch. 6,784 project-dept pairs. ⚠️ NOT Controls Engineering — frequently confused. CE is 110E. |
| 106 | Mechanical Assembly | 106 | Assembly + machine shipping. 4,587 project-dept pairs |
| 108 | Electrical Assembly | 108 | Panel building, wiring. 1,955 project-dept pairs |
| 110 | Mechanical Engineering | 110M | Mech design. 600K+ total hrs, 112 unique employees. 1,790 project-dept pairs. ⚠️ Legacy code 110 has 0 hrs since 2010 — all migrated to 110M. Note: Dan Haveman (Emp 394) = PMO, logs scheduling here early — use P2 date for real design start. |
| 111 | Controls & Electrical Eng | 110E | CE software/hardware design. 531K+ total hrs, 73 unique employees. 1,842 project-dept pairs. ⚠️ Code 111 never used in timesheets (<2 hrs ever) — always 110E. |
| 115 | Proposal Engineering | 115 | 359 project-dept pairs |
| 120 | MVI | 120 | Installation, travel, field service, meetings. 2,220 project-dept pairs. |
| (sub) | Test/Startup/Runoff | 122 | Subdivision of MVI. Always separate in timesheets (96K hrs 2020+). Test/startup, runoff, laser alignment, troubleshooting, customer training. Most time on op 4800-TEST/STARTUP. 1,651 project-dept pairs. |
| 125 | Process Services | 125 | Separate job shop division. 622+ employees, ~977K hrs (2020+). Exclude from machine-build workforce analysis. |
| 130 | Process Development | 130 | Testing, sample processing, engineering studies. 526 project-dept pairs |
| 135 | Customer Service / Field Svc | 135 | Post-handoff support, calibration. 62 project-dept pairs |
| 140 | Sales | 140 | Low volume in timesheets |
| 150 | Supply Chain | 150 | Receiving, stock |
| 160 | Materials Flow | 160 | Warehouse, shipping |
| 170 | Operations | 170 | |
| 180 | Admin | 180 |
Controls Engineering operation codes (Op Desc):
| Op Code | Op Desc | Category |
|---|---|---|
| 2055 | CONTROL ADMINISTRATI | Admin/coordination |
| 2120 | CONTROLS DESIGN | Core hardware design |
| 2130 | CONTROL DOCUMENTATIO | Drawing/documentation |
| 2140 | SOFTWARE DESIGN | PLC/HMI programming |
| 2150 | SOFTWARE TEST | Testing/validation |
| 2151 | CONTROL TRAVEL | Travel for CE work |
| 2162 | FLOOR ENGINEER | CE on shop floor (rework indicator) |
| 2020 | MECH DESIGN PRODUCT | Product-level mechanical |
| 2100 | MECH DESIGN PROJECT | Project-level mechanical |
| 2110 | MECH DOCUM PROJECT | Mechanical documentation |
Analysis insight (Feb 2026): FLOOR ENGINEER hours (op 2162) are a strong rework indicator. Good projects average 0.8 hrs, bad projects average 22 hrs (28x difference). SOFTWARE DESIGN (op 2140) is the single largest driver of CE overruns — 26x more hours on bad projects.
ecn.csv — Detailed Schema
Last Verified: 2026-03-06 — Schema confirmed via direct file read.
| Column | Description | Example |
|---|---|---|
| ECN No | ECN identifier | ”7890” |
| Rev | Revision number | ”A” |
| Project | Job number | ”2422” |
| Drawing | Part/drawing number affected | ”92345-1” |
| Code | Change type classification | ”Engineering” |
| Description | Free text description | ”Revised bracket dim” |
| Chg Dept | Department initiating change | ”110M” |
| Date | ECN date | ”05/15/23” |
| Department flag columns | A102, A104, A106, A108, A110E, A110M, A120 | ”Y” / "" |
| RFCNumber | Link to RFC/Redbook if applicable | ”12345” |
Code field distribution (28,266 records):
| Code | Count | % | Meaning |
|---|---|---|---|
| Engineering | 22,414 | 79.3% | Engineer-initiated design changes |
| Customer | 2,320 | 8.2% | Customer-requested scope changes |
| Product Improvement | 982 | 3.5% | Proactive design improvements |
| Manufacturing | 916 | 3.2% | Shop floor process changes |
| Purchasing | 586 | 2.1% | Supply chain substitutions |
| Process Change | 178 | 0.6% | Manufacturing process changes |
| (blank/other) | ~870 | 3.1% | Unclassified |
Key finding (2026-03-06): Customer-requested ECNs (8.2%) are uncorrelated with corrective labor hours (P/C=‘C’ in tslabor2) at project level (r=0.089). This means the corrective hours signal in workforce features genuinely captures rework, not customer scope changes.
ECN-to-RFC linkage: 1,928 ECNs link to 1,511 RFCs via the RFCNumber field, enabling join from ECN back to Redbook quality issues.
Dept code mapping (ganttjob.csv vs tslabor2): ganttjob uses compound codes like 110E and 110M which match tslabor2 exactly. The dept codes are the SAME between ganttjob and tslabor2. Verified Feb 2026.
Dept milestones (computed inline): The nightly pipeline computes FirstDate/LastDate/TotalHrs/UniqueEmps per (Job, Dept) directly from the tslabor2 stream during stream_tslabor2(). Output: department_summary.csv (~16K rows). The old fabric_dept_milestones.json has been eliminated — no Fabric dependency needed.
Comprehensive Analytics Dataset (CSV — Flat Export)
Last Verified: 2026-03-09
| Property | Value |
|---|---|
| What | Master per-project analytics dataset — 2,569 projects × 249 columns |
| Where | \\ad.ptihome.com\DFS\Schedule\SS123\LEADTIME\comprehensive_dataset.csv |
| Repo | psi-data-pipeline/pipeline/build_comprehensive_dataset.py (exports CSV from same pipeline that builds the DB) |
| Format | Pipe-delimited CSV |
| Refresh | Nightly at 1 AM ET via GHE Actions on PS-PROXY (nightly-data-build.yml). Also manual: python pipeline/build_comprehensive_dataset.py |
| Sources | 13 data sources: otd_dataset, tslabor2 (dept milestones computed inline), ganttjob (LDS + PMO), ganttjob_lds_revisions, jobparts, purchaseorders, pohist, ecn, openwo, budgetjob, wiplabor, redbook_coq.db |
| Answers | ”Which factors correlate with DaysLate?”, “How do metrics differ by era?”, “Which hypothesis explains the OTD collapse?” |
Key metric columns: ActiveProjectsAtShip, TS_Avg_Concurrent, TS_Avg_Weekly_Switches, DM_110E_Span, DM_CE_MVI_Overlap, RB_RFC_Count, ECN_Count, JP_Part_Count, PO_Days_From_Order, TS_Op2162_Hrs, WO_Avg_Cycle_Days, GJ_Revision_Count, GJ_Total_Resched_Days
Operation-level columns: Per-department category rollups (TS_{dept}_Productive_Hrs, TS_{dept}_Overhead_Hrs, TS_{dept}_Rework_Hrs × 8 depts) + 20 individual operation columns (TS_Op{code}_Hrs for key ops across all departments). Rework columns are key analysis signals — troubleshooting hours correlate strongly with delays.
P2/P98 substantial engagement columns: DM_{dept}_P2 (substantial start), DM_{dept}_P98 (substantial end), DM_{dept}_P2P98_Span (substantial duration) × 8 departments = 24 columns. These compute the dates at which 2% and 98% of cumulative labor hours were booked per department, trimming early check-in and late punch-list tails. Key finding: Machine Shop full span overstates engagement by 29 days median; Weld by 51 days. Using P2/P98 strengthens all causal correlations (e.g., Controls Eng finish → Elec Assembly start: r=0.825 with P2/P98 vs r=0.743 with First/Last).
Companion outputs: causation_analysis.txt, department_scorecard.csv, vendor_scorecard.csv
Full-fidelity detail outputs (all source columns preserved, in LEADTIME\detail\):
labor_detail.csv— 1.38M rows, all 17 tslabor2 columns for project jobsdepartment_summary.csv— 15,966 rows, per-(job, dept) aggregates with P2/P98 datesjobparts_project.csv— 202K rows, all 10 columnspurchaseorders_project.csv— 13.6K rows, all 19 columnswiplabor_project.csv— 204K rows, all 16 columnsbudgetjob_project.csv— 1,059 rows, all 27 columnsoperation_summary.csv— every (Job, Dept, Op) combination with hours
purchaseorders.csv — Schema Notes
Last Verified: 2026-02-26
Promise Date field is the CURRENT (possibly revised) promise date, not the original. AFTEC supports 4 promise date/qty revisions per line (via VB_PO.LINE.REV1), but only the latest is exported.
Schedule Date is 38.6% empty across all records. When present, 68% of non-empty Schedule dates are pushouts averaging +12 days from promise.
Confirm Date is the vendor order acknowledgment date, NOT the delivery confirmation.
1.4 Microsoft Fabric / Power BI — ProgressiveDataSet (Migrating to Azure SQL)
Last Verified: 2026-02-26
| Property | Value |
|---|---|
| What | ”Golden Set” semantic model — same 33 tables from CSV exports |
| Where | Fabric workspace (John Tymes personal) |
| Workspace ID | 4879a6ff-c0c4-4f1a-87b5-638a21e04f5f |
| Dataset ID | 51d7822c-8d17-4fb5-b28f-50a4c6fdd19e |
| Access | DAX queries via Azure CLI (az rest) — must be logged in |
| Refresh | Daily at 5:00 AM ET |
| Answers | Same as CSV files but queryable with DAX aggregations |
Query Pattern:
az rest --method POST \
  --url "https://api.powerbi.com/v1.0/myorg/groups/{workspace}/datasets/{dataset}/executeQueries" \
  --resource "https://analysis.windows.net/powerbi/api" \
  --body '{"queries": [{"query": "EVALUATE ..."}], "serializerSettings": {"includeNulls": true}}'
CRITICAL LIMITATION — No Versioning or Change History:
Fabric’s ProgressiveDataSet does NOT retain versioning, changelogs, or historical snapshots. Each daily refresh at 5AM is a full overwrite of the previous data:
- No snapshots of what data looked like yesterday vs today
- No diff tracking on changed records (e.g., PO promise date changes)
- No deleted record retention — if a row is removed from the CSV, it’s gone
- No audit trail for field-level changes over time
Impact: This means we cannot answer questions like “What was the original promise date?” or “When did this WO status change?” from Fabric or CSV data alone. Only the current state is available.
Recommended fix: Implement daily snapshot archiving — copy CSVs to a dated folder before Fabric refreshes. This is a 10-minute PowerShell scheduled task on the file server. See Known Gaps.
1.5 Schedule Excel Files (\\ad.ptihome.com\DFS\Schedule\)
Last Verified: 2026-02-26
| Property | Value |
|---|---|
| What | PMO scheduling workbooks — department schedules, project Gantt charts |
| Where | \\ad.ptihome.com\DFS\Schedule\SS123\SCHEDULE\ (ENG/ and PROD/) |
| Access | Via PSI.UniData.API /api/schedule/dev/* endpoints |
| Refresh | Manual (updated by PMO team) |
Department Schedule Files
| Department | File | Path |
|---|---|---|
| Mech Engineering | Mecheng.xlsm | ...\ENG\Mecheng.xlsm |
| Controls Engineering | CONTROLS.xlsm | ...\ENG\CONTROLS.xlsm |
| Machine Shop | AMACH.xlsm | ...\PROD\AMACH.xlsm |
| Weld | AWELD.xlsm | ...\PROD\AWELD.xlsm |
| Mech Assembly | AMECH.xlsm | ...\PROD\AMECH.xlsm |
| Elec Assembly | AELECT.xlsm | ...\PROD\AELECT.xlsm |
| MVI/Startup | AMVI.xlsm | ...\PROD\AMVI.xlsm |
| Floor Space | Floor Space Capacity Chart.xlsm | ...\PROD\Floor Space... |
Each file contains: Priority, Project#, Customer, Hours Estimated, Deviation, Hours-to-Go, Weekly hour allocations
Per-Project LDS Gantt Files
| Property | Value |
|---|---|
| Path Pattern | \\ad.ptihome.com\DFS\LDS\PROJECT\{JobNo}\lds\{JobNo}lds.xlsm (also K:\PROJECT\{JobNo}\lds\{JobNo}lds.xlsm via mapped K: drive) |
| Coverage | ~3,092 project directories; LDS files exist from approximately job 1900+ (projects from ~late 1990s onward) |
| Sheets Parsed | Project Info, Project Release (milestones), Gantt (weekly bars) |
| Milestone Fields | Department, Description, PlannedDate, ActualDate, IsComplete |
| Gantt Fields | Department, WeekDate, Hours, Color (from cell fill) |
| Extraction Tool | psi-data-pipeline/pipeline/extract_lds_gantt.py — batch-extracts planned dept start/end dates from Gantt sheets into CSV format compatible with load_ganttjob(). Runs nightly via GHE Actions. Uses openpyxl to parse colored cells and date headers. |
Gantt sheet format (per LDS file): Row layout varies by era but typically: issue date row (with month headers), day-of-month row, week number row. Department sections (MECHANICAL ENGINEERING, CONTROLS ENGINEERING, PURCHASING, MACHINE, WELD, etc.) have colored cells indicating planned weekly work. The extraction script auto-detects the header row layout and handles 2-digit/4-digit years, placeholder dates, and year rollovers.
Why ganttJOB.csv is insufficient: ganttJOB.csv only exports from the PMO scheduling system for currently active projects (~83 jobs). When a project ships, it rotates out. For historical Gantt data (planned dept start/end), the per-project LDS files are the only source.
API Access:
GET /api/schedule/dev/summary→ PMO priorities, HTG, deviation, bayGET /api/schedule/dev/departments→ All 7 department weekly gridsGET /api/schedule/dev/lds/{jobNumber}→ Project milestones + Gantt
1.6 Redbook Quality Database
Last Verified: 2026-02-26
| Property | Value |
|---|---|
| What | Quality issue tracking — 50,000+ records since 1999 |
| Sources | REDBOOK.1287 (UniData), redbook.csv (CSV export), redbook_coq.db (SQLite) |
| Access | PSI.UniData.API /api/redbook/*, CSV files, Streamlit dashboard |
| Answers | ”How many quality issues per project?”, “Resolution times?”, “Cost of quality?” |
Key Metrics:
- Days Open, Days to Close, Days to First Action
- Department assignment/completion tracking (16 departments)
- Problem type, root cause, severity (AI-classified)
- Ship timing category (Early/Mid/Late/At-Ship/Post-Ship)
- Cost of quality (labor + material with stage multipliers)
1.6b SolidWorks PDM (Engineering Drawings & BOMs)
Last Verified: 2026-03-18
| Property | Value |
|---|---|
| What | Product Data Management — engineering drawings, 3D models, Bills of Materials |
| Where | SolidWorks PDM vault (on-premises) |
| Access | SolidWorks client, PDM search, BOM exports to CSV |
| Key Data | Drawings (PDF/DWG), BOMs (RawData/BOM_Exports/*.csv), part revisions |
| Answers | ”What’s the BOM for this assembly?”, “Where is this part used?”, “What revision is current?” |
BOM hierarchy follows the GTCode structure: FACILITY → ASSEMBLY → MODULE → PHYS. (Physical Part). PDM provides “where used” queries to find all assemblies containing a specific part — critical for design reuse analysis. BOM exports feed the nightly pipeline via jobparts.csv and per-project BOM CSV files.
1.7 Project Explorer Dataset
Last Verified: 2026-02-26
| Property | Value |
|---|---|
| What | 25+ years of project history with timeline visualization |
| Where | C:\git\project-explorer\public\RawData\ |
| Key File | Project1287List.xml (4.3 MB, 3,084 projects) |
| Access | Parsed client-side in React app, or read XML directly |
| Answers | ”Lead time trends over 25 years”, “On-time delivery rate” |
Lead Time Fields:
OrderDate→ShipDate= Actual Lead Time (days)OrderDate→PlannedShipDate= Planned Lead Time (days)SlipDays= Actual - Planned (positive = late)
Supporting Data in same directory:
quote_revenue.json(16 MB) — Quote and revenue dataredbook_data.json(4.8 MB) — RFC data for all projectscontrol_components.json(7.3 MB) — Controls component data
1.8 PLC Complexity Scores
Last Verified: 2026-03-03
| Property | Value |
|---|---|
| What | Per-project PLC program complexity scores for 487 Allen-Bradley ACD projects |
| Where | C:\git\PLC\fleet_complexity_scores.csv (raw scores), fleet_complexity_trend.csv (yearly summary), fleet_complexity_joined.csv (joined to lead time data) |
| Repo | C:\git\ra-logix-designer-vcs-custom-tools\scripts\ — batch-complexity-scan.py + build-complexity-trend.js |
| Format | CSV |
| Refresh | Manual batch scan: C:/Python311/python.exe batch-complexity-scan.py --resume (~4-8 hrs full fleet). Supports incremental resume. |
| Answers | ”How complex is the PLC program for job X?”, “Has machine complexity trended up over time?”, “Which machine types are most complex?” |
CSV columns: Job, Complexity, TotalRungs, TagCount, UdtDepth, RoutineCount, ProgramCount, AvgRungs, JsrDepth, TimerDensity, TonCount, AcdFile, LastModified, Error
Scoring algorithm — 7 weighted sub-metrics (0–100 scale):
| Sub-metric | Weight | Raw Scale | Measures |
|---|---|---|---|
| rungCount | 20% | 0–3500 rungs | Program size |
| avgRungs | 20% | 0–100 rungs/routine | Routine density |
| tagCount | 15% | 0–200 tags | Tag usage |
| routineCount | 15% | 0–80 routines | Program structure |
| udtDepth | 10% | 0–4 levels | Data type sophistication |
| jsrDepth | 10% | 0–3 levels | Call depth / nesting |
| timerDensity | 10% | 0–15 timers per 100 rungs | Sequencing complexity |
Extraction paths:
- v29+ ACDs (109 projects): Full extraction via
acd-tools ExportL5x— all 7 sub-metrics including tags and UDTs parsed fromTagInfo.XML - v12–v20 ACDs (378 projects): Fallback path reads partial sqlite DB directly — 5 sub-metrics (tagCount=0, udtDepth=0 due to no TagInfo.XML)
Key finding (2026-03-03): Median PLC complexity was stable at 32–35 from 2010–2022, then accelerated sharply. Median: 37 (2022) → 41 (2024) → 48 (2025). P75 jumped from ~37 (2010–2021) to 55 (2025). Maximum complexity nearly doubled (47→73). The top quarter of recent projects are 50% more complex than anything built pre-2022. See §8 for full analysis record.
Join key: Job → comprehensive_dataset.csv Job column. fleet_complexity_joined.csv has the pre-built result (451 of 487 matched = 92%).
1.9 Machine DNA Quality Prediction System
Last Verified: 2026-03-06
| Property | Value |
|---|---|
| What | Per-project quality risk prediction — 6 dimensions, 82 features, 3,088 projects |
| Where | Processed/redbook_coq.db (SQLite tables) + Processed/*.json |
| Repo | C:\git\redbook-dashboard |
| Refresh | Manual: python Scripts/build_machine_dna.py then python Scripts/train_machine_dna_model.py |
| Answers | ”Which new projects are at risk?”, “What predicts quality problems?”, “Are R&D projects skewing our data?” |
SQLite tables:
| Table | Rows | Description |
|---|---|---|
machine_dna_features | 3,088 | Per-project feature matrix (config, novelty, complexity, comp history, workforce) |
project_rd_classification | ~100 | R&D project flags with confidence, signals, override status |
JSON outputs:
| File | Description |
|---|---|
Processed/machine_dna_model_results.json | AUC per tier, SHAP importance, hypothesis verdicts, per-process-type results |
Processed/machine_type_profiles.json | Machine type quality profiles |
Feature dimensions:
| Dimension | Prefix | Features | Available At |
|---|---|---|---|
| 1. Configuration Identity | config_ | Machine type, process type, customer history, value tier | Order |
| 2. Physical Novelty | novelty_ | First-time parts %, new module %, reuse ratio | BOM Release |
| 3. BOM Complexity | complexity_ | Part count, depth, unique parts | BOM Release |
| 4. Comp Machine History | comp_ | Reference machine quality, cost propagation | Order |
| 5. Controls/PLC | plc_ | PLC complexity score (from §1.7) | BOM Release |
| 6. Workforce | wf_ | Team tenure, HHI concentration, lead experience, corrective hours | Staffing/Build |
Model performance (time-aware expanding-window CV, honest):
- Tier 1 (At Order): AUC 0.507
- Tier 1.5 (At Staffing): AUC 0.631
- Tier 2 (BOM Release): AUC 0.639
- Tier 3 (Early Build): AUC 0.630
- Field Escape: AUC 0.614
Top SHAP features: wf_corrective_hrs_pct (0.709), wf_ce_top_person_pct (0.330), novelty_phys_first_time_pct (0.245), comp_avg_quality_cost (0.198)
R&D classification signals: XML keyword scan (Description/SPNName), statistical outliers (>3x process-type median COQ%), machine type heuristics (Tooling/Fixture/Test), extreme novelty (95%+ first-time parts on first build).
1.10 Additional Document Sources
Last Verified: 2026-03-06
Handoff Notes (.docx)
| Property | Value |
|---|---|
| What | Project handoff documents — comp/reference machines, risks, specs, team assignments |
| Where | I:\QUOTES\{SPN}\PO-Contract\{SPN}ho*.docx (e.g., S9507ho - Project 2422.docx) |
| Linkage | SPNNo field in Project1287List.xml → SPN folder on I: drive |
| Coverage | ~2,274 projects have SPN links (88% of shipped projects) |
| Format | Word .docx — parseable with python-docx |
| Answers | ”What was the reference machine?”, “What risks were identified at handoff?”, “Who was assigned?” |
Key extractable fields: Machine-Same-As-Except (comp references), project risks, customer specs, team assignments, special requirements. The comp machine references are particularly valuable — they supplement the 80 projects currently extracted from SLDS Index headers.
OneNote Lessons Learned
| Property | Value |
|---|---|
| What | Post-project lessons learned notes organized by project |
| Where | S:\OneNote\Lessons Learned\Projects.one (90 MB) |
| Format | Binary .one format — NOT directly parseable without COM API or Microsoft Graph |
| Access | Requires OneNote COM automation (Windows) or Graph API (cloud). HTML export possible per-section. |
| Answers | ”What went wrong on project X?”, “What lessons were captured?” |
Limitation: Binary format prevents batch extraction. Options: (1) COM API automation on Windows, (2) Graph API if notebook is in SharePoint/OneDrive, (3) manual HTML/MHT export per section.
K: Drive Change Order Files (AFTEC Binary)
| Property | Value |
|---|---|
| What | Engineering change order documents with structured BOM change data |
| Where | K:\PROJECT\{job}\chg\chg.NNN (e.g., K:\PROJECT\2422\chg\chg.001) |
| Format | AFTEC binary format (NOT WordPerfect) — contains structured fields extractable via raw byte string parsing |
| Coverage | Most projects from ~1999 onward |
| Answers | ”What BOM changes were made?”, “Which parts were added/removed/modified?”, “Change order timeline?” |
K: drive directory structure per project (K:\PROJECT\{job}\):
| Subfolder | Contents |
|---|---|
chg\ | Change order files (AFTEC binary, chg.NNN) |
lds\ | LDS Gantt file ({job}lds.xlsm) |
PO\ | Purchase order documents |
bom\ | BOM export files |
dwg\ | Engineering drawings |
Note: K: is a mapped drive to \\ad.ptihome.com\DFS\LDS\PROJECT\.
1.11 Document Manager File Sources (DFS Shares)
Last Verified: 2026-03-16
The Document Manager desktop application (PSI.DocumentManager) is a WPF document viewer that provides access to project files, product documentation, industry data, and multimedia. It reads from several DFS network shares that are not covered by the analytics pipeline or REST API.
Sales Quotes
| Property | Value |
|---|---|
| What | Sales project folders — quotes, proposals, and related documents |
| Where | \\ad.ptihome.com\dfs\SalesQuotes\QUOTES\{SPN} |
| Access | Direct file read (VPN required) |
| Consumer | Document Manager (search with “S” prefix, e.g., “S9507”) |
| Answers | ”What documents exist for sales project X?” |
Product Documentation (LDS)
| Property | Value |
|---|---|
| What | Product-level technical documents — organized by document type and product number |
| Where | \\ad.ptihome.com\dfs\LDS\Product\{code}\{productNumber}.{extension} |
| Format | Various document types per product |
| Consumer | Document Manager (Products tab) |
| Answers | ”What documentation exists for product X?” |
Document type codes:
| Code / Subfolder | Document Type |
|---|---|
ATT\{classId}.ATT | Product Attributes |
STD\{classId}.STD | Product Standards |
G | General Description |
DO | Description of Operation |
MC | Manual Controls |
FLT | Faults and Messages |
SP | Spare Parts |
MS | Maintenance Schedule |
MP | Maintenance Procedures |
VM | Vendor Manuals |
TP | Test Plan |
RAC | Runoff Acceptance Criteria |
SHP | Shipping Instructions |
SW | Software |
O | Outline |
Industry Sectors (LDS)
| Property | Value |
|---|---|
| What | Industry sector strategy documents |
| Where | \\ad.ptihome.com\dfs\LDS\Industry Sectors\{IDNumber}\{IDNumber}_strategy.doc |
| AFTEC Tables | INDSECTOR.1287 (sectors), INDCLASS.1287 (classes) |
| Consumer | Document Manager (Industries tab) |
| Answers | ”What is PSI’s strategy for industry sector X?”, “Which industry classes exist?” |
AFTEC schema:
| Table | Key Fields | VB Subroutine |
|---|---|---|
INDSECTOR.1287 | SECTOR (ID), NAME, IND.CLASS, SALES.PERSON | Via PSILocalService |
INDCLASS.1287 | IND.CLS (ID), DESC, IND (Industry) | Via PSILocalService |
MultiMedia — Part Photos & Videos
| Property | Value |
|---|---|
| What | Part-level photos and videos, organized by industry application and process type |
| Where | \\ad.ptihome.com\dfs\Data\MultiMedia\ (photos and videos); \\ad.ptihome.com\dfs\Data\MultiMedia\Photo\Lo Res Project Files\{projectId} (lo-res project photos) |
| AFTEC Table | PART.PHOTOS.1287 — metadata index with file paths, titles, and project associations |
| Consumer | Document Manager (Part Photos tab, Part Videos tab, and project lo-res photos) |
| Answers | ”What part photos/videos exist for this industry application and process type?”, “What does this project’s machine look like?” |
AFTEC schema — PART.PHOTOS.1287:
| Field | Description |
|---|---|
| ID | Record ID |
| FILE PATH | File location on DFS |
| PART.TYPE.DESC | Part type description |
| DESC | Title / description |
| PROJECT | Associated project number |
| IND.CLASS | Industry classification code |
| PROCESS.TYPE | Process type code (0001=ShotPeen, 0002=Blast, 0003=Plasma, 0004=WaterJet, 0005=Other) |
| MEDIA.TYPE | 1 = Photo, 2 = Video |
VB subroutine: VB_PARTPHOTOLIST.REV1 — query: SSELECT PART.PHOTOS.1287 BY PART.TYPE.DESC BY DESC BY PROJECT WITH IND.CLASS = '...' WITH PROCESS.TYPE = '...' WITH MEDIA.TYPE = '...'
Application type hierarchy (both photos and videos):
| Code | Application Type |
|---|---|
| AERO | Aerospace |
| AUTO | Automotive |
| LGHT | Light Industry |
| HEQP | Heavy Equipment |
| GENL | General |
| MILT | Military |
| ENGY | Energy |
| MDCL | Medical |
| OTHER | Other |
Product Categories & Products (AFTEC)
| Property | Value |
|---|---|
| What | Product classification hierarchy — categories contain products with BOM and documentation links |
| AFTEC Tables | PRODUCT.CLASS.1287 (categories), PRODUCT.LDS.1287 (product listing), PRODUCT.1287 (product details) |
| Consumer | Document Manager (Products tab) |
| Answers | ”What product categories exist?”, “What products are in category X?”, “What is the BOM for product Y?” |
AFTEC schema:
| Table | Key Fields | VB Subroutine |
|---|---|---|
PRODUCT.CLASS.1287 | CLASS (ID), CLASS.NAME | VB_PRODUCTCLASSLIST.REV1 |
PRODUCT.LDS.1287 | Product ID, PHYS.NO, PROD.CLASS, INACT.OBS | VB_PRODUCTLIST.REV1 |
PRODUCT.1287 | PARTNO, DESC, ENGSTAT, PHYS, GTCODE, PRODDWG + 20 more fields | Via PSILocalService |
Loading strategy: Virtualized — categories load first, then products load on-demand per category expansion. BOM loaded via GetBOMDetailsAsync(partNumber) when product node is expanded.
SolidWorks Master Drawings
| Property | Value |
|---|---|
| What | Engineering drawings cache — used to check if SolidWorks drawings exist for products |
| Where | X:\MasterDwgs\*.slddrw |
| Consumer | Document Manager (Products tab — drawing existence check) |
| Cache | File list cached in memory as a HashSet, refreshed every 5 minutes |
Electrical Drawing PDFs (DWG Conversions)
| Property | Value |
|---|---|
| What | AutoCAD electrical/pneumatic schematics converted from DWG to PDF for web viewing |
| Where | \\ad.ptihome.com\DFS\CAD\PDF\dwg_pdf\{job}\{drawingNumber}.pdf |
| Source DWGs | \\ad.ptihome.com\DFS\CAD\DWGFiles\{drawingNumber}.DWG |
| Drawing Index | \\ad.ptihome.com\DFS\CAD\Controls\{job}\{job}.wdp (text file listing 6-digit drawing numbers) |
| Conversion Tool | DwgToPdf.exe (eDrawings 2025 ActiveX Print5 method) |
| Pipeline | Nightly via psi-plc-runner/scripts/batch-dwg-to-pdf.ps1 on PS-PLCRunner |
| Consumer | PSI Explorer Machine Explorer (Drawings tab → ViewerPage), MCP server (GET /files/drawing/:pn/pdf) |
| Current Coverage | 234 PDFs across 4 projects (2337, 2386, 2399, 2415) |
| Answers | ”Show me the E-stop schematic for machine 2399”, “What’s on drawing 359920?” |
Note: These are separate from the mechanical PDFs at \\ad.ptihome.com\DFS\CAD\PDF\{partNumber}.pdf which are SolidWorks-generated part drawings keyed by part number. Electrical PDFs are keyed by 6-digit drawing number and organized by project.
Print Queue / My Reports
| Property | Value |
|---|---|
| What | User-specific report files printed from AFTEC |
| Where | \\ad.ptihome.com\dfs\Data\UnixShare\PrintQue\PrintToFile |
| Consumer | Document Manager (My Reports tab) |
| Filter | Files filtered by logged-in user’s Windows username (case-insensitive) |
1.12 Project Minutes (PROJMIN) — Weekly Status Narrative
Last Verified: 2026-06-18
| Property | Value |
|---|---|
| What | Weekly engineering project-status meeting minutes (“Project Minutes” memo, issued by PMO). One file per week; each is a full snapshot of every active project (~105 jobs/week). The only narrative, week-by-week timeline of each project’s lifecycle. |
| Where | \\ad.ptihome.com\DFS\DATA\Dept\Eng\GENERAL\STATINFO\PROJMIN\ (mapped S:\Dept\Eng\GENERAL\STATINFO\PROJMIN), in per-year folders MIN1997…Min2026 |
| Format | .docx (≈2013→present, 628 files) and legacy WordPerfect .WPD (1997→2012, 797 files) |
| Coverage | 1,422 weekly files → 71,963 job-week records over 1,797 jobs, continuous 1997–2026 |
| Refresh | Manual, ~weekly (Mondays) |
| Answers | ”When did job X actually ship / run off / install / start up?”, “How long did it sit built-and-accepted before shipping?”, “Why did it slip?”, “What was the new-build↔retrofit lineage?”, “Who were the PM/engineer?” |
Document structure (uniform across all 29 years): header (Date / To = distribution initials / From / Subject: Project Minutes), then two sections — MACHINE ORDERS (new builds, 4-digit jobs) and WORK ORDERS (retrofits/upgrades, 5-digit 95xxx). Each project is a header line job ⟶ PM,Eng initials ⟶ Customer – Machine description [$] [(Closed – use 95931)] [(was 95855)] followed by status lines (modern: tab-delimited phase columns; pre-2013: free-text bullets, where a leading ? marks a change-since-last-week).
Extraction method (reproducible: projmin_extract.py)
- WPD → text. The 797 WordPerfect files are converted with LibreOffice headless (its WordPerfect import filter is libwpd) installed on PS-PROXY:
soffice --headless --norestore --convert-to txt:Text --outdir OUT <files>, batched ~80 files/invocation (Windows command-line length limit). 796/797 convert; 1 is corrupt. Note: reading the DFS share from inside a remote WinRM session fails (Kerberos double-hop) — stage files over the session withCopy-Item -ToSessioninstead. The.WPDarchive is static, so this conversion is one-time. - Filename → meeting date (4 conventions): 1997
MIN+MDDYY (5 digits); 1998–2000MN+MMDDYY; 2001–2015Mn+MMDDYY (2-digit year); 2016–2026Mn+MMDDYYYY. Clamp year to [1997, now+1] (one mis-named file otherwise yields “9021”). - Parse each file into
(meeting_date, job, section, pm/eng, status_text)rows — header regex^(\d{4,5})(?:/\d+)?\t+([A-Z]{2,3}(?:,…)*)\t+(.*), accumulating following lines as the status block until the next job/section. - Per-job milestones: first week matching
\bshipped\b; firstrunoff (complete|done|passed|signed); terminal-milestone = last week matchinghandoff/startup/runoff/manufacturing/install complete. Lineage from(Closed – use N),(was N),Upgrades?/Update to N. - Join to Project1287List.xml on
IDNumberDisplay(= job number); compare to AFTECShipDate.
Timeline anchor (coalesce method)
anchor_date = AFTEC ShipDate → minutes "Shipped" week → terminal-milestone proxy, recording anchor_source. This resolves projects that have no ship date in either source: of the 1,722 minutes-jobs matched to AFTEC, the “neither” cases split into in-progress (Active — correctly date-less), cancelled (correct), and closed-needs-anchor (old jobs that rotated off the active list at startup/handoff before a “Shipped” line was ever logged, and whose ERP ShipDate was never populated). The terminal-milestone proxy recovers those. Result: 96% of matched jobs (1,666/1,722) get a usable anchor (1,574 AFTEC ShipDate + 36 minutes-ship-fills-ERP-blank + 56 terminal proxy); the residual 19 old jobs fall back to labor-cessation / DateClose (see 7. KNOWN GAPS & LIMITATIONS, and internal-project completion-dating).
Verification results (vs AFTEC ShipDate)
- Of 1,116 jobs dated in both sources: median difference +5 days, 82% within ±10 days — independent validation of AFTEC
ShipDate. - 79 jobs disagree by >30 days (reconciliation list); 36 jobs shipped per minutes but have a blank AFTEC
ShipDate(ERP gaps); 75 minutes-jobs have noProject1287List.xmlrecord. - Runoff-complete → ship hold: median 28 days, p90 77; 43% of jobs hold >30 days built-and-accepted before shipping — a legitimate on-time-metric refinement.
Join key: job (minutes) ↔ IDNumberDisplay (Project1287List.xml) ↔ Job/project (analytics tables). Caveat: milestone dates are weekly-resolution (±7 days). Status: POC validated; not yet a pipeline job (planned load_project_minutes.py → project_minutes_weekly / project_milestones_minutes / job_lineage).
2. API & TOOL ACCESS
2.1 PSI.UniData.API (REST Gateway)
Last Verified: 2026-02-26
| Property | Value |
|---|---|
| URL | https://api.progressivesurface.com/api |
| Auth | Azure AD (production) or dev endpoints (no auth) |
| Repo | C:\git\PSI.UniData.API |
Endpoint Categories
| Category | Endpoints | What They Access |
|---|---|---|
| BOM | /bom/dev/job/{job}, /bom/dev/part/{part} | BOM explosion with full hierarchy |
| Parts | /parts/dev/{part}, /parts/search | Part details, search |
| Work Orders | /wo/dev/{wo} | WO details (status, dates, completion) |
| Projects | /project/dev/{job}/info, /project/dev/{job}/siblings | Project metadata, similar machines |
| Schedule | /schedule/dev/summary, /schedule/dev/departments | Excel schedule data |
| Redbook | /redbook/rfc/{rfc}, /redbook/by-project/{job} | Quality issues |
| Data | /data/dev/{tableName}, /data/dev/{table}/{id} | Raw table queries |
| Dictionary | /dictionary/tables, /dictionary/search | Schema discovery |
| Hours | /hours/dev/burn/{job} | Hours burndown data |
2.2 PSI Machine Intelligence MCP Server
Last Verified: 2026-02-26. For current tool count and full tool list, see MCP Server.
| Property | Value |
|---|---|
| Where | C:\git\PLC\mcp-server\mcp-server.js |
| Used By | PSI Explorer “Ask the Fleet” AI chat, Claude Code, Claude Desktop |
| Answers | Complex multi-source questions about machines |
Tool Categories
| Category | Tools | Key Capabilities |
|---|---|---|
| Project | get_project_info, find_similar_machines, get_project_lineage, list_machine_types | Project metadata, machine type analysis |
| BOM/Supply | get_bom, get_part_details, get_part_manufacturer, get_part_vendors, search_parts | Full BOM and supply chain data |
| PLC/Controls | get_plc_analysis, analyze_acd, lookup_fault, get_io_map, lookup_plc_tag, lookup_pc_read_write, get_robot_interface | PLC program analysis, I/O mapping |
| Engineering | list_project_files, find_drawing, get_electrical_drawing_index, read_drawing_pdf, read_bom_file, get_drawing_metadata, check_commissioning_readiness | Drawing and document access |
| Quality | get_rfcs, get_vendor_history | Redbook and vendor tracking |
| Work Orders | get_work_orders | WO list by project |
| Analysis | diagnose_fault, compare_projects, assess_obsolescence_risk | Cross-system diagnostics |
| Inventory | get_inventory_status, get_inventory_transactions, get_inventory_history, analyze_inventory_discrepancy | Inventory analytics |
| Cost | analyze_part_cost_leakage, get_job_cost_attribution | Cost attribution |
| Utility | get_digital_thread, find_acd_files | Pre-built composite reports |
2.3 PSI Explorer Web
Last Verified: 2026-03-02
| Property | Value |
|---|---|
| URL | https://explorer.progressivesurface.com |
| Repo | C:\git\psi-explorer-web |
| What | Unified manufacturing intelligence portal — projects, BOM, schedule, lead time analysis, PLC scorecard, AI chat |
| Data Joins | PROJECT.1287 + PROJECT.HRS.1287 + MACHTYPE.1287 + Schedule Excel + Accounts + comprehensive_dataset.csv + department_scorecard.csv |
Key Views:
- Project Dashboard — Ships next 30/60/90, behind schedule count, OTD rate
- Capacity View — Department schedules, weekly hour grids
- Project Detail — LDS milestones, Gantt, hours burndown, RFCs, WOs
- Lead Time Analysis — 8-tab deep dive: Dashboard, Explorer, Era Comparison, Dept Heatmap, Capacity & OTD, Hypotheses, Timeline (2,569 projects, 138 columns, data back to 2000)
- PLC Scorecard — Automated complexity/safety/reuse scoring for PLC programs
- PSI Explorer — Hierarchical BOM viewer with search and drill-down
2.4 Redbook Analysis Dashboard (v7.3)
Last Verified: 2026-03-09
| Property | Value |
|---|---|
| URL | https://quality.progressivesurface.com (Entra ID auth) |
| Repo | C:\git\redbook-dashboard |
| Database | Processed/redbook_coq.db (SQLite) |
| What | 10-tab quality analytics dashboard (Streamlit) |
Tabs:
| # | Tab | What It Shows |
|---|---|---|
| 1 | Overview | Summary metrics, KPIs, top-level quality trends |
| 2 | By Project | Project rankings by RFC count, cost, severity |
| 3 | Root Causes | AI-classified root cause breakdown and patterns |
| 4 | Trends | Time series of quality issues, costs, categories |
| 5 | Deep Dive | Preventability analysis of top design issues |
| 6 | Products | Product-level quality tracking and recurring escapes |
| 7 | Explorer | General data explorer with flexible filtering |
| 8 | Lead Time | Lead time analysis and schedule performance |
| 9 | Machine DNA | Machine DNA quality profiling, model results, SHAP features |
| 10 | Project Explorer | Per-project quality deep dive — synthesizes all data sources for a single project |
Tab 10 — Project Explorer (new in v7.3):
Single-project deep dive that brings together every available data source into one view:
- Project selector — searchable by job number or customer, shows RFC count and ship year
- DNA radar chart — project’s 6-dimension feature profile vs machine type average
- RFC timeline — scatter plot of issues by severity with ship date marker
- Workforce profile — median tenure, junior %, CE concentration (HHI), corrective hours %
- Risk recommendations — risk score (0–100), category, and generated recommendations
- Comp machine comparison — reference machines with side-by-side quality and DNA metrics
- Lessons learned — post-project review notes from OneNote extraction
- ECN/NCN detail — expandable table of engineering changes and non-conformances
5 new data loaders (added in v7.3):
load_lessons_learned()— OneNote-extracted lessons by projectload_ecn_details(project)— ECN records filtered by projectload_ncn_details(project)— NCN records filtered by projectload_workforce_features()— 15 workforce features per project (tenure, concentration, corrective hrs)load_comp_machine_references()— comp/reference machine mappings from SLDS Index
2.5 Document Manager (WPF Desktop — PSI.DocumentManager)
Last Verified: 2026-03-16
| Property | Value |
|---|---|
| What | WPF desktop document viewer — project files, product documentation, industry data, multimedia |
| Repo | C:\git\PSI.All\PSI.DocumentManager\Trunk\PSI.DocumentManager\ |
| Data Access | PSILocalService (WCF) → U2 Toolkit → AFTEC UniData |
| Auth | Windows domain authentication |
Primary consumer of DFS file shares and several AFTEC tables not used by other applications. Document Manager is the main way users browse project folders, product documentation, industry sector data, and part photos/videos.
Data Access Layer — PSILocalService (WCF)
Document Manager accesses AFTEC via PSILocalService, a WCF service hosted by PSI.Service (PSI.Shared/trunk/PSI.Windows.Services/PSI.Service/). This is a separate access path from the PSI.UniData.API REST gateway — it uses the same U2 Toolkit for .NET but through WCF instead of HTTP.
Key service methods:
| Method | AFTEC Table | VB Subroutine | Returns |
|---|---|---|---|
GetOnePTIProjectAsync(job) | PROJECT.1287 | — | Project metadata (PTIProjectModel) |
GetProductCategoryList() | PRODUCT.CLASS.1287 | VB_PRODUCTCLASSLIST.REV1 | Product categories |
GetProductByClassListAsync(classId) | PRODUCT.LDS.1287 | VB_PRODUCTLIST.REV1 | Products per category |
GetBOMDetailsAsync(partNumber) | BOM tables | — | Bill of Materials hierarchy |
LoadIndustrySectors() | INDSECTOR.1287 | — | Industry sectors |
LoadIndustryClass() | INDCLASS.1287 | — | Industry classes |
GetPartMedia(indClass, processType, mediaType) | PART.PHOTOS.1287 | VB_PARTPHOTOLIST.REV1 | Part photos (type=1) or videos (type=2) |
Tabs & Data Sources
| Tab | AFTEC Source | DFS Source |
|---|---|---|
| Projects | PROJECT.1287 (metadata) | \\ad.ptihome.com\dfs\LDS\PROJECT\{job} (files) |
| Sales Projects | — | \\ad.ptihome.com\dfs\SalesQuotes\QUOTES\{SPN} |
| Products | PRODUCT.CLASS.1287, PRODUCT.LDS.1287, PRODUCT.1287, BOM | \\ad.ptihome.com\dfs\LDS\Product\ (docs), X:\MasterDwgs\ (SolidWorks) |
| Industries | INDSECTOR.1287, INDCLASS.1287 | \\ad.ptihome.com\dfs\LDS\Industry Sectors\ |
| Part Photos | PART.PHOTOS.1287 (mediaType=1) | \\ad.ptihome.com\dfs\Data\MultiMedia\ |
| Part Videos | PART.PHOTOS.1287 (mediaType=2) | \\ad.ptihome.com\dfs\Data\MultiMedia\ |
| My Reports | — | \\ad.ptihome.com\dfs\Data\UnixShare\PrintQue\PrintToFile |
| My Computer | — | Local/network drives |
3. DATA RELATIONSHIPS (Join Keys)
Last Verified: 2026-02-26
PROJECT.1287 ←── JobNumber ──→ openwo (Job field)
     │                              │
     │                              ├──→ tslabor2 (Job field)
     │                              ├──→ wiplabor (Job No field)
     │                              ├──→ wiprouteline (Job field)
     │                              └──→ ganttWO (Job field)
     │
     ├── JobNumber ──→ ganttJOB (Job field)
     ├── JobNumber ──→ redbook (Project field)
     ├── JobNumber ──→ ecn (Project field)
     ├── JobNumber ──→ jobparts (Job field)
     ├── JobNumber ──→ budgetjob (Job field)
     ├── AccountNo ──→ customer (Customer No)
     ├── JobNumber ──→ LDS Excel (file path pattern)
     ├── JobNumber ──→ Schedule Excel (project row)
     └── JobNumber ──→ PART.PHOTOS.1287 (PROJECT field)

PRODUCT.CLASS.1287 ←── ClassID ──→ PRODUCT.LDS.1287 (PROD.CLASS)
                                          │
                                          └──→ PRODUCT.1287 (product details)

INDSECTOR.1287 ←── IND.CLASS ──→ INDCLASS.1287 (IND.CLS)
               └── IND.CLASS ──→ PART.PHOTOS.1287 (IND.CLASS)

openwo ←── PartNo ──→ partmaster (Part No)
                           │
                           ├──→ purchaseorders (Part No)
                           ├──→ inventory (Part No)
                           └──→ inventoryhistory (Part No)

employee ←── EmpNo ──→ tslabor2 (Emp field)
                   └──→ redbook (Ent By field)

tslabor2 ←── Job+Dept ──→ ganttJOB (Job+Dept)     [schedule vs actual labor]
         ←── Job+Emp  ──→ budgetjob (Job)          [budget vs actual hours]
         ←── Dept+Date ──→ (timeline heatmaps)     [when labor occurs in project lifecycle]

machine_dna_features ←── project ──→ PROJECT.1287 (JobNumber)
                     ←── project ──→ redbooks (Project)
                     ←── project ──→ comprehensive_dataset (Job)

project_rd_classification ←── project ──→ machine_dna_features (project)

ecn.csv ←── RFCNumber ──→ redbook.csv (ID)        [ECN-to-RFC linkage]
        ←── Project ──→ PROJECT.1287 (JobNumber)

Project1287List.xml ←── SPNNo ──→ I:\QUOTES\{SPN}\  [handoff notes]
Key Join Fields
| From | To | Join Key | Notes |
|---|---|---|---|
| Any project data | Work orders | JobNumber = openwo.Job | Core link |
| Work orders | Labor | WO = tslabor2.WO | Track hours per WO |
| Work orders | Routing | WO = wiprouteline.WO | Planned vs actual by operation |
| Projects | Quality | JobNumber = redbook.Project | RFCs per project |
| Projects | Schedule | JobNumber in Excel files | PMO schedule data |
| Projects | Customers | AccountNo = customer.Customer No | Customer name |
| Projects | Budget | JobNumber = budgetjob.Job | Budget vs actual by dept |
| Parts | Vendors | PartNo = purchaseorders.Part No | Supply chain |
| Parts | Lead Times | PartNo = partmaster.Part No | Mfg/Pur/Cum LT |
| Labor | Timeline | Job + Date vs OrderDate | Normalize labor to project timeline |
| Labor | Engineers | Emp = Employee Name | Cross-project engineer loading |
Cross-Source Analysis Joins (Proven in Feb 2026 Investigation)
These joins have been validated through actual analysis:
| Analysis | Sources Joined | Join Strategy |
|---|---|---|
| Lead time by stage | Project1287 + ganttJOB + openwo | JobNumber, then aggregate by Dept |
| Good vs bad projects | budgetjob + tslabor2 + redbook + purchaseorders | JobNumber across all tables |
| CE labor timeline heatmap | tslabor2 (Dept=110E) + Project1287 (OrderDate) | Job, then normalize dates by OrderDate |
| Vendor OTD | purchaseorders + pohist | PO number + line, Promise vs Rcv Date |
| Department capacity | tslabor2 (hours) + wc-capacity (capacity) | Department code |
| Engineer cross-project loading | tslabor2 grouped by Emp + Job | Employee name, sum hours per project |
| Comprehensive causal dataset | otd_dataset + 12 sources | JobNumber across all; PO linkage via regex on Job/WO No field |
| CE/MVI timing overlap | fabric_dept_milestones (110E LastDate vs 120 FirstDate) | (Job, Dept) key; CE last date vs MVI first date |
| Employee concurrent load | tslabor2 grouped by (Emp, YYYY-MM) | Count unique Jobs per employee per month |
| Part complexity trend | jobparts grouped by Job No | Count parts per project, track by ship year |
| PLC complexity trend | fleet_complexity_scores.csv + comprehensive_dataset.csv | Job = Job; 451 matched (92%); fleet_complexity_joined.csv has pre-built result |
| Machine DNA quality prediction | machine_dna_features + labor_detail + comp_machine_references + project_complexity + redbook_coq.db | project key across all; 6 dimensions, 82 features, 3,088 projects |
| Workforce feature engineering | labor_detail.csv (1.38M rows) + department_summary.csv | Job+Emp for tenure; Job+Dept for concentration; comp_machine_references for team overlap |
| R&D project classification | Project1287List.xml + redbook_coq.db + machine_dna_features | XML keyword scan + statistical outlier detection + novelty extremes |
| ECN type analysis | ecn.csv (Code field) + redbook.csv (via RFCNumber) | ECN→RFC linkage for 1,928 ECNs; Code breakdown per project |
4. QUESTIONS THIS DATA CAN ANSWER
Last Verified: 2026-02-26
Lead Time & Schedule Analysis
| Question | Primary Source | Supporting Sources |
|---|---|---|
| ”What’s the average lead time trend by year?” | Project1287List.xml (OrderDate, ShipDate) | project-explorer LeadTimeView |
| ”Which projects are behind schedule?” | Schedule Excel (Deviation column) | ganttJOB.csv (% Complete) |
| “Which department is the bottleneck?“ | ganttJOB.csv (Start/End per dept) | tslabor2.csv (hours by dept) |
| “How long do work orders take?“ | openwo.csv (Make→Close dates) | wiprouteline.csv (planned vs actual) |
| “Are we over on hours by department?” | PROJECT.HRS.1287 (budget vs actual) | wiplabor.csv (routed vs actual) |
| “What’s the hours-to-go for active projects?” | Schedule summary API | Department Excel files |
| ”How do quality issues impact schedule?“ | redbook.csv (Days Open, dept flags) | ecn.csv (change volume) |
| “Are vendors delivering on time?“ | purchaseorders.csv (Promise vs Rcv) | pohist.csv (receipt dates) |
| “What’s our capacity vs load?“ | wc-capacity.csv | capacity.csv |
| ”What’s the on-time delivery rate?” | Project1287List.xml (Planned vs Actual ship) | project-explorer OTD calc |
| ”Where do CE hours land on the project timeline?“ | tslabor2.csv (Dept=110E, Date, Job) | Project1287 (OrderDate for normalization) |
| “Which engineers are overloaded?“ | tslabor2.csv (Emp, Job, Hours) | budgetjob (CE budget vs actual) |
| “Is this a good or bad project?“ | budgetjob (budget vs actual %), tslabor2, redbook | Cross-source: budget %, RFC count, CE hours |
| ”Are machines getting more complex over time?“ | fleet_complexity_trend.csv | fleet_complexity_joined.csv for per-project detail |
| ”What’s the PLC complexity of job X?“ | fleet_complexity_scores.csv (Job column) | fleet_complexity_joined.csv for ship year / machine type context |
| ”Which machine types have the most complex PLC programs?“ | fleet_complexity_joined.csv | Join Complexity + MachineType from comprehensive_dataset |
| ”Which new projects are at risk for quality problems?“ | machine_dna_features + model_results.json | Tier 1 (at order) through Tier 3 (early build) predictions |
| ”What predicts quality problems?“ | machine_dna_model_results.json (SHAP values) | Corrective hours, CE concentration, novelty, comp history |
| ”Is this project R&D or production?“ | project_rd_classification | Keyword, statistical, novelty signal detection |
| ”What type of ECN changes drive rework?“ | ecn.csv (Code field) | Engineering (79%), Customer (8%), Manufacturing (3%) |
| “Does this project’s team have enough experience?“ | machine_dna_features (wf_ columns) | Median tenure, junior %, lead CE/ME tenure, HHI |
Department-Level Analysis
| Department | Code | Schedule Source | Hours Source | Quality Source |
|---|---|---|---|---|
| Mech Eng | 110M | Mecheng.xlsm | tslabor2 (Dept=110M) | redbook A110M flags |
| Controls Eng | 110E | CONTROLS.xlsm | tslabor2 (Dept=110E) | redbook A110E flags |
| Machine Shop | 102 | AMACH.xlsm | tslabor2 (Dept=102) | redbook A102 flags |
| Weld | 104 | AWELD.xlsm | tslabor2 (Dept=104) | redbook A102 flags |
| Mech Assembly | 106 | AMECH.xlsm | tslabor2 (Dept=106) | redbook A106 flags |
| Elec Assembly | 108 | AELECT.xlsm | tslabor2 (Dept=108) | redbook A108 flags |
| MVI/Startup | 120 | AMVI.xlsm | tslabor2 (Dept=120) | redbook A120 flags |
| Field Service | 135 | — | tslabor2 (Dept=135) | service tickets |
5. ACCESS PATTERNS (Quick Reference)
Last Verified: 2026-02-26
”I need to query data about…”
| Topic | Fastest Method | Command/Endpoint |
|---|---|---|
| Current project status | API | GET /api/project/dev/{job}/info |
| Full BOM for a job | API | GET /api/bom/dev/job/{job} |
| Department schedule | API | GET /api/schedule/dev/department/{dept} |
| Project milestones | API | GET /api/schedule/dev/lds/{job} |
| Work order details | API | GET /api/wo/dev/{wo} |
| Quality issues by project | Azure SQL | SELECT * FROM redbooks WHERE project = '{job}' |
| Aggregate WO statistics | Azure SQL | SELECT job, COUNT(*) FROM work_orders GROUP BY job |
| Labor hours by dept/year | Azure SQL | SELECT dept, SUM(labor) FROM tslabor2 WHERE ... |
| CE labor by engineer/project | Azure SQL | SELECT * FROM labor_detail WHERE dept = '110E' |
| ECN breakdown by type | Azure SQL | SELECT code, COUNT(*) FROM ecn_detail WHERE project = '{job}' GROUP BY code |
| Workforce risk metrics | Azure SQL | SELECT * FROM workforce_features WHERE job = '{job}' |
| Lead time trends | Project Explorer | LeadTimeView component |
| Historical project data | Azure SQL | SELECT * FROM projects WHERE ship_year >= 2020 |
| Vendor lead times | Azure SQL | SELECT * FROM partmaster WHERE [Part No] = '{part}' |
| Work center capacity | Azure SQL | SELECT * FROM [wc-capacity] |
| Budget vs actual by dept | Azure SQL | SELECT * FROM budgetjob WHERE Job = '{job}' |
| Engineer workload across projects | Azure SQL | SELECT [Employee Name], Job, SUM(Labor) FROM tslabor2 GROUP BY ... |
6. DATA FRESHNESS & RELIABILITY
Last Verified: 2026-03-12
| Source | Freshness | Reliability | Versioning | Notes |
|---|---|---|---|---|
| Azure SQL PSI_Analytics | Nightly (1 AM) | High | Git (psi-data-pipeline) | Primary data store — app/report query target |
| UniData API (live) | Real-time | High | None | Direct ERP queries |
| AFTEC CSVs (DFS share) | ~Daily (5 AM) | High | Daily snapshots | AFTEC export jobs; archived by archive_csv_snapshots.py |
| psi_ingest.db (SQLite) | Per-source refresh / workflow-driven | High | Git (psi-data-pipeline) | Durable staging DB for scraper-owned tables; survives analytics rebuilds |
| psi_analytics.db (SQLite) | Nightly (1 AM) | High | Git (psi-data-pipeline) | Rebuildable analytics artifact and local publish source before Azure SQL sync |
| Fabric ProgressiveDataSet | Daily (5 AM) | High | None — full overwrite | Being migrated to Azure SQL |
| Schedule Excel | Manual | Medium | None | Depends on PMO updating |
| LDS Gantt Excel | Manual | Medium | None | Depends on PM updating per project |
| comprehensive_dataset.csv | Nightly (1 AM) | High | Git (psi-data-pipeline) | Flat export from Azure SQL pipeline |
| Redbook SQLite DB | Pipeline run | High | None | Run on demand |
| Project1287List.xml | Export-time | High | None | Snapshot at export |
No PSI data source currently has full change-data-capture. Most sources still reflect current state only. Daily CSV snapshots (archive_csv_snapshots.py) provide basic change tracking for AFTEC exports, and the ingest/publish workflows now verify that ingest-owned tables make it into both psi_analytics.db and Azure SQL before the workflow succeeds. Historical analysis still relies primarily on dates already embedded in records (e.g., OrderDate, ShipDate, MakeDate) rather than on system-level change logs.
7. KNOWN GAPS & LIMITATIONS
Last Verified: 2026-02-26
| Gap | Impact | Workaround | Priority |
|---|---|---|---|
| No single “lead time by stage” dataset | Can’t directly query stage durations | Join ganttJOB + openwo + wiprouteline | Low (join works) |
| No versioning in Fabric/CSV | Can’t track field changes over time (PO promise dates, WO status) | Implement daily CSV snapshot archiving | High |
| PO promise date is current-only | Can’t measure original vs revised promise date drift | Expose VB_PO.LINE.REV1 (4 date/qty pairs) via API | High |
| Schedule Excel is manually maintained | May lag reality | Cross-check with WO completion dates | Medium |
| LDS milestones often unfilled | Many projects have null planned/actual dates | Use ganttJOB dept start/end instead | Low |
FIXED (2026-03-02): LDS Gantt extraction now runs nightly. 457 LDS files parsed, 4,213 dept rows + 9,824 revision rows. GJ_* columns populated for 418+ projects. Pipeline moved to psi-data-pipeline/pipeline/. | N/A | Resolved | |
| Redbook detection timing is estimated | Based on entry date vs ship date | Reasonable proxy | Low |
| No automated root cause for delays | Must infer from data patterns | Combine hours overrun + WO lateness + RFC volume | Medium |
| Capacity data is limited | Only 31 rows in wc-capacity | Supplement with PMO floor space data | Medium |
FIXED (2026-03-03): PLC complexity pipeline scored 487 ACDs — fleet_complexity_scores.csv has per-project scores (7 sub-metrics). Median complexity 48 in 2025 vs 32–35 baseline (2010–2022). See §1.7. | N/A | Resolved | |
| Schedule Date field 38.6% empty | Inconsistent PO tracking | Use Promise Date + pohist Rcv Date as primary OTD measure | Low |
| pohist PO Date is placeholder | PO Date in pohist.csv is almost always 01/01/01 (Jan 1 2001) — cannot compute vendor lead time from pohist alone | Join pohist receipt dates to purchaseorders.csv Promise Date via PO number; or use purchaseorders.csv only for vendor LT analysis | Medium |
| purchaseorders Job/WO linkage is weak | Job/WO No field requires regex parsing (format varies: F58637-2322, etc.); only 34% of PO lines match to known project numbers | Build WO→Job mapping from openwo.csv, or parse with known job set. Coverage limited to recent active projects. | Low |
| jobparts coverage is 51% | Only 498 of 2,569 shipped projects have jobparts.csv data (BOM part list) | May only cover recent or active projects. For historical BOM complexity, use redbook_coq.db project_boms table (4.3M rows, much better coverage) | Low |
FIXED (2026-03-11): ecn_detail table in Azure SQL includes Code field. Query: SELECT code, COUNT(*) FROM ecn_detail WHERE project = '{job}' GROUP BY code | N/A | Resolved | |
FIXED (2026-03-11): 551 handoff extractions loaded into handoff_extractions table in Azure SQL. Comp machine refs, risk notes extracted from I: drive .docx files. | N/A | Resolved | |
FIXED (2026-03-11): 1,166 lessons from 263+ projects extracted via UTF-16LE binary scan and loaded into lessons_learned table in Azure SQL. | N/A | Resolved | |
FIXED (2026-03-11): 8,395 change orders extracted from K: drive chg/ binaries and loaded into change_orders table in Azure SQL. Part numbers and drawing refs parsed. | N/A | Resolved | |
| Honest model AUC is modest | Time-aware CV dropped from shuffled 0.749-0.806 to honest 0.507-0.639; Tier 1 barely above chance | Expected — temporal leakage inflated old scores. Tier 1.5+ useful for relative risk ranking, not absolute prediction | Low |
8. ANALYSIS HISTORY
Analyses performed against PSI data, with links to findings. This tracks what questions have been answered and what data combinations were used.
| Date | Analysis | Sources Used | Key Finding | Report |
|---|---|---|---|---|
| 2026-02-26 | Lead time root cause | 11 sources, 9.6M records | Lead time doubled to 330d; Purchasing, CE, EA top contributors | Lead Time Report |
| 2026-02-26 | Good vs bad project comparison | budgetjob, tslabor2, redbook, purchaseorders | CE is #1 differentiator (25% vs 190% budget); 4x more RFCs on bad projects | Investigation Log |
| 2026-02-26 | CE labor timeline heatmap | tslabor2 (110E), Project1287, budgetjob | Bad projects have 12x CE hours; SOFTWARE DESIGN is 26x overrun; two-wave pattern | C:\git\schedule\PSI CE Labor Timeline Analysis.docx |
| 2026-02-26 | Vendor OTD deep dive | purchaseorders, pohist | OTD dropped 81%→69%; Kendall Electric 73% late; promise date tracking gap found | C:\git\schedule\PSI Lead Time Deep Dive - Good vs Bad Projects.docx |
| 2026-02-27 | Comprehensive causal analysis | 13 sources, 2,569 projects, 138 columns | Built re-runnable dataset; tested 10 causal hypotheses. Key: CE span (r=+0.203) is strongest single correlator with DaysLate; concurrent projects jumped 10.8→14.2 in overload; CE finishes before MVI only 33-43% of the time; RFC count stable (38-42) but ECNs rose 11→15. | C:\git\schedule\build_comprehensive_dataset.py → comprehensive_dataset.csv + causation_analysis.txt |
| 2026-03-02 | Pipeline automation & Data Brain alignment | 13 sources, 2,569 projects, 152 columns | Moved pipeline to psi-data-pipeline/pipeline/. Eliminated Fabric JSON dependency (dept milestones computed inline from tslabor2 stream). Added full-fidelity detail outputs (6 files, all source columns preserved). Added LDS Gantt revision/reschedule data (14 new columns). Nightly automated builds on PS-PROXY via GHE Actions. | psi-data-pipeline/pipeline/ → \\ad.ptihome.com\DFS\Schedule\SS123\LEADTIME\ |
| 2026-03-03 | PLC complexity trend analysis | 487 ACD projects (all versions) + comprehensive_dataset.csv (2,569 projects) | Batch-scored entire ACD fleet (batch-complexity-scan.py using acd-tools). Two extraction paths: full (v29+, 109 projects, 7 sub-metrics) and fallback (v12–v20, 378 projects, 5 sub-metrics). 487 scored, 11 errors. Joined to lead time data: 451 matched (92%). Key finding: median complexity stable 32–35 from 2010–2022, then surged to 37→41→48 (2022→2024→2025). P75 jumped from ~37 to 55. Max complexity nearly doubled (47→73). Closes the “no SW complexity metric” gap. | C:\git\PLC\fleet_complexity_scores.csv, fleet_complexity_trend.csv, fleet_complexity_joined.csv |
| 2026-03-06 | Machine DNA quality prediction (honest rebuild) | redbook_coq.db + labor_detail.csv + comp_machine_references + project_complexity + Project1287List.xml | Built 6-dimension, 82-feature quality prediction model across 3,088 projects. Three workstreams: (A) Workforce features — 15 wf_ columns from labor_detail (tenure, HHI concentration, lead experience, corrective hours). (B) R&D classification — flagged ~100 projects using keyword/statistical/novelty signals. (C) Honest model rebuild with time-aware expanding-window CV, COQ% target within process type, SHAP explainability. Results: Tier 1 AUC 0.507, Tier 1.5 AUC 0.631, Tier 2 AUC 0.639. Top SHAP: corrective_hrs_pct (0.709), ce_top_person_pct (0.330), novelty (0.245), comp_quality (0.198). Old shuffled baselines (0.749-0.806) were inflated by temporal leakage. | C:\git\redbook-dashboard\Processed\machine_dna_model_results.json, Scripts/train_machine_dna_model.py |
| 2026-03-06 | ECN change code analysis | ecn.csv (28,266 records) + tslabor2 corrective hours | Discovered ecn.csv Code field classifies changes: Engineering (79.3%), Customer (8.2%), Product Improvement (3.5%), Manufacturing (3.2%). Customer ECN rate is UNCORRELATED with corrective labor (r=0.089) — corrective hours genuinely capture rework, not customer scope changes. ECN-to-RFC linkage: 1,928 ECNs link to 1,511 RFCs via RFCNumber field. 46% of quality cost is ECN-driven but mostly engineering-initiated. | C:\git\redbook-dashboard\Documentation\DATA_CATALOG.md |
Related Pages
- Data Dictionary — Analytics output table field reference
- Redbook Schema — REDBOOK.1287 UniData field reference
- Fabric ProgressiveDataSet — Power BI/DAX query access & table schemas
- Inventory & Work Orders — WO types, AFTEC inventory tables, IBM tracking
- PSI.All Architecture — .NET codebase, UniData subroutines, data access patterns
- Build Pipeline — Process flow documentation
- PSI Explorer — Manufacturing intelligence portal
- UniData API — REST endpoint reference
- MCP Server — AI tool access (see for current tool count)
- Redbook Analysis — Quality analytics dashboard
- Lead Time Analysis 2026 — Root cause report
- Lead Time Investigation — Discovery log
- Methodology — Metric calculations
Last updated: March 18, 2026 Maintenance: Update this page whenever new data sources, joins, or gotchas are discovered during analysis.